Web App2026
Valuation Desk
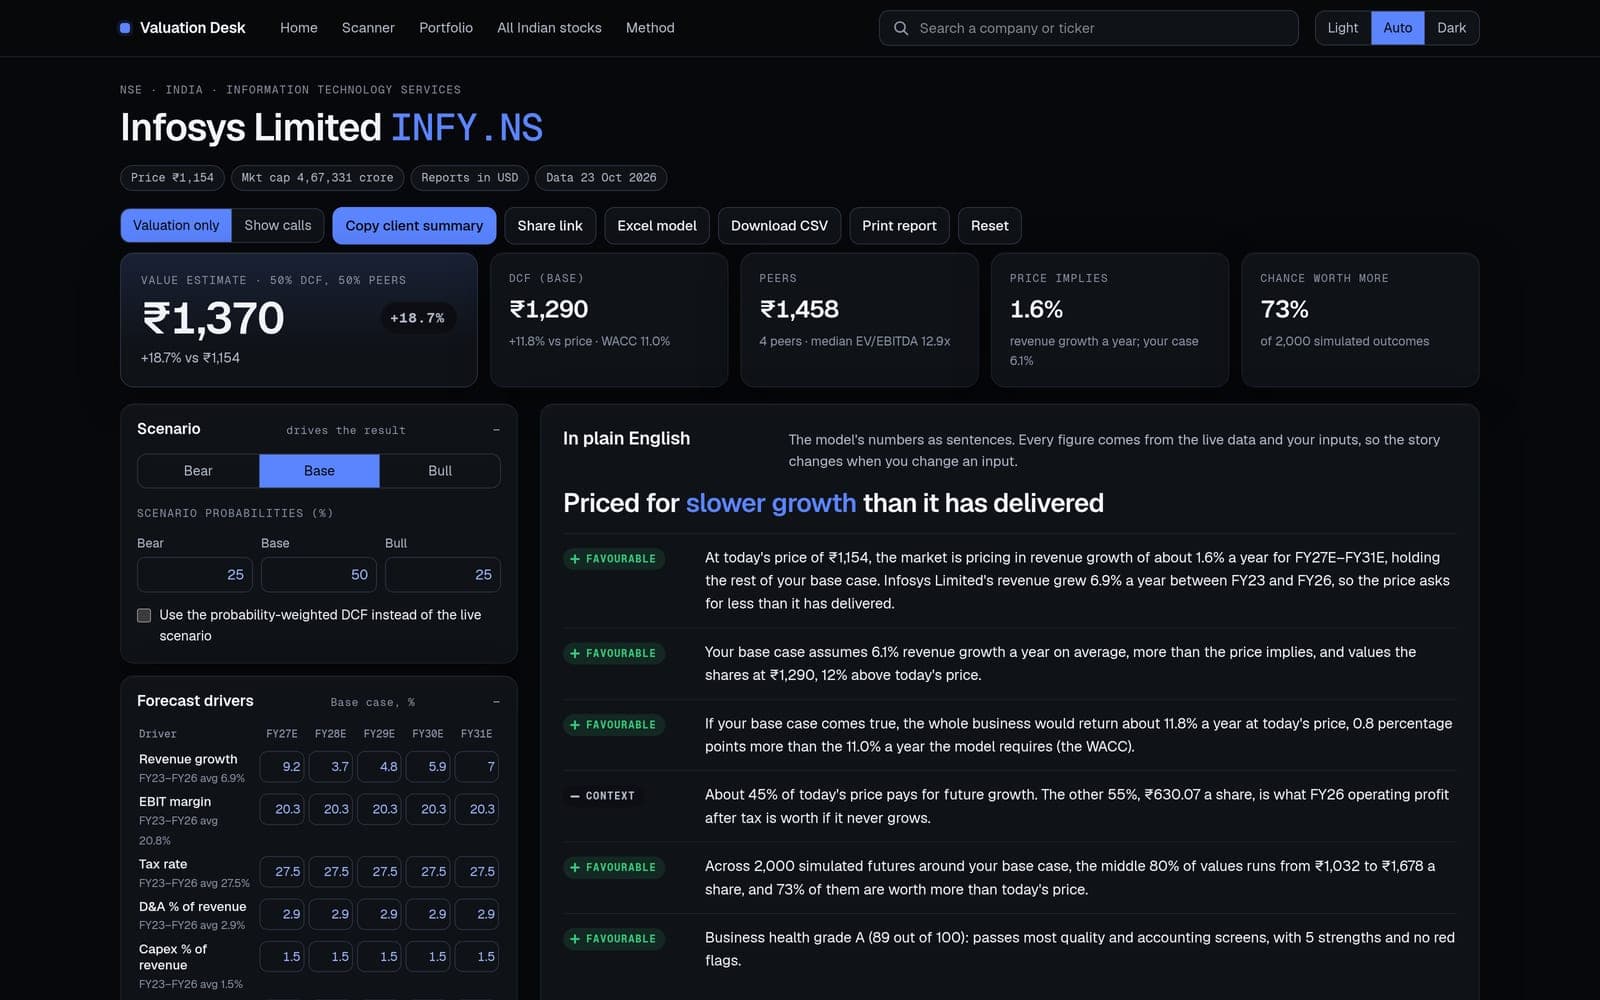
Type any listed stock and get a working valuation from its live statements: a DCF, peers, a reverse DCF and a health check, explained in plain English.
- Type
- Personal project
- Year
- 2026
- Platform
- Web
- Role
- Sole author
- Collaboration
- Solo, written with Claude Code
- Timeline
- Oct 2026
- Stack
- TypeScript · Next.js 16 · React 19 · yahoo-finance2 · ExcelJS · Vitest
The problem
A discounted cash flow model is the first thing a finance student is taught and the last thing anyone builds for fun. Each one starts as an empty spreadsheet: five years of statements typed in from annual reports, a discount rate pieced together from three sources, and a share count that is out of date by the next buyback. Then someone asks what the number means and the spreadsheet has no answer.
Valuation Desk starts from the ticker instead. Any company listed on the NSE, or
any Yahoo symbol worldwide (AAPL, BP.L, 7203.T), opens as a model that is
already built from the live price and five years of reported statements, with
every input editable and every result written out as a sentence.
What it does
- A value estimate that blends a DCF (bear, base and bull, with probability weights) and peer multiples. Banks, insurers and holding companies get peer P/E and P/B only, because for a lender debt is raw material rather than financing and a free-cash-flow DCF does not describe the business.
- A reverse DCF: the revenue growth today's price implies, set against what the company has actually delivered.
- A health check from the Piotroski F-score, Altman Z'' and Beneish M-score, plus 2,000 simulated outcomes around the base case.
- What analysts expect and how far the price may move: broker targets set against the user's value, and a one-year price range from the stock's own volatility. It is a range, not a direction; the app never predicts a price.
- A scanner, a portfolio X-ray and live top-50 rankings for India, the US, the UK, Japan, Germany and China, ranked by market value in each market's own currency.
- Exports: an Excel workbook built with live formulas rather than pasted values, plus CSV, a printable report and share links that carry the whole model in the URL.
Works locally, missing in production
The India top 50 looked right on my machine, with Reliance and TCS near the top. Deployed to Vercel, both were gone, and nothing had errored.
Yahoo answers differently depending on where the request comes from. From Vercel's US servers, the quote for several large Indian companies came back without a market value or a share count. A ranking by market value quietly dropped them, which meant it dropped exactly the companies a reader would look for first. I only saw it by putting a temporary debug route on the deployed site and reading the raw fields from Vercel's own region.
Hard-coding share counts would go stale with the next buyback or bonus issue, and retrying asks the same server the same question. The fix is a chain: the quote, then the price and key-statistics modules, then the share count from the latest balance sheet. On top of that, a ranking refuses to cache itself unless at least 95% of the Indian candidates came back valued, so a partial answer is never stored and served as the answer for the next 15 minutes.
Statements that lie about their currency
Yahoo labels HCLTech's financial currency as US dollars and serves its annual statements in rupees. Taken at its word, the app would have converted rupee figures to rupees a second time and multiplied every line by the exchange rate.
The label cannot be trusted, so the data has to settle it. Yahoo's trailing revenue is in the labelled currency; when the latest annual revenue divided by it sits near the exchange rate rather than near 1, the statements are in the local currency and the page says so in a note. One more failure hid behind the first: HCLTech's reported operating profit came out larger than its EBITDA, which is impossible, so operating profit is rebuilt as EBITDA minus depreciation when that happens.
One dead ticker took down fifty
Quotes are fetched in batches of 50. One symbol in the German list that Yahoo no longer quotes failed the library's schema check, and the check throws for the whole batch, so 49 good companies disappeared along with it. Batched quotes now skip that validation, each row is checked on its own, and a row that comes back incomplete falls through to lookups for that company alone.
How the numbers are checked
- 153 unit tests, all on pure functions: the valuation engine, health check, returns, the plain-English story, scanner ranking, portfolio import, share-link decoding and the risk statistics.
- The Excel model is recomputed outside Excel. For Infosys, Reliance, HDFC
Bank and Alphabet I recalculated every formula with Python's
formulaspackage and compared the results with the web engine: 0 mismatches across all four. Getting there caught two real bugs: a sheet named "History", which Excel reserves, and ranges that named their sheet twice (DCF!$D$33:DCF!$H$33). - Every top-50 list was swept through the live scanner: 50 of 50 valued in all six markets, with 6 Indian and 7 US results flagged as extreme for a closer look.
- A contradiction test on the health check. Removing the three Piotroski tests that do not apply to lenders left ICICI Bank graded C on a shortened score. Lenders now skip the F-score entirely instead of being marked down by half of it.
What it does not do
- The data is not licensed. Prices and statements come from Yahoo through an unofficial library: delayed, sometimes missing, and not cleared for commercial use. A paid service would need a licensed data provider behind the same adapter.
- Risk-free rates are sourced for two markets. India uses a dated value and the US the live 10-year Treasury yield; every other currency uses an estimate flagged on the page for the user to replace.
- There are no accounts. Inputs live in the browser and share links carry the model in the URL, so there is no client book, no saved history and no alerts.
- The risk range assumes the recent past continues. It uses two years of weekly volatility and five years of prices, so a crisis like 2008 or early 2020 is deeper than anything the window shows.